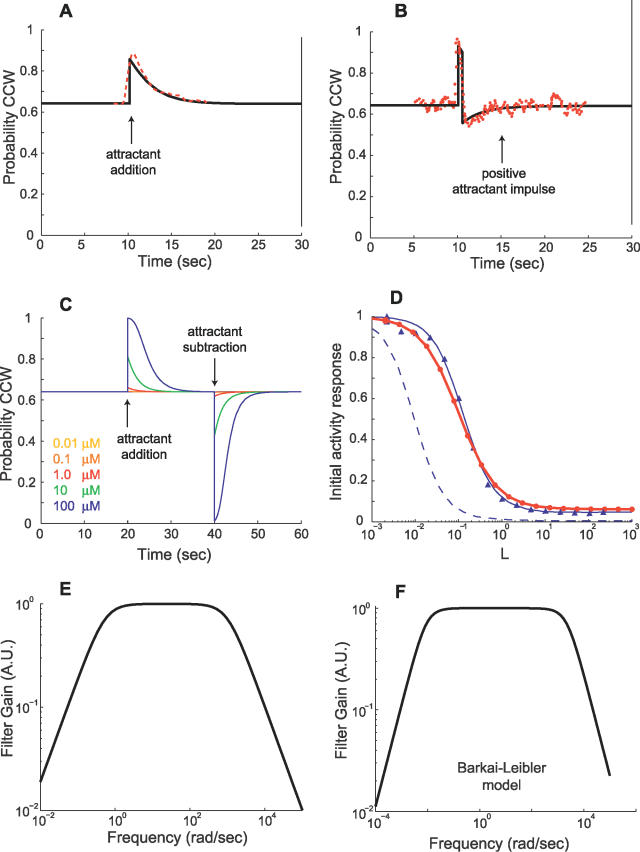
Figure 9. Validation of E. coli Signaling Network Model.
(A) Response of the E. coli signaling network model is plotted for a 0.1-mM step increase in chemoattractant concentration from 0.2 mM at 10 s. For comparison with experimental data, activity from the model is converted to the probability of CCW flagella rotation by means of a Hill function (Materials and Methods). A transient response after an initial increase in CCW probability adapts to the pre-stimulus level. Adaptation times are similar to experimentally obtained data [20,27] (red dashed line shows data from Figure 2 of [27]).
(B) Response to a positive (+0.2 mM) chemoattractant impulse of width 0.5 s is also consistent with experimentally observed behavior [20,27] (red dots show data from Figure 1 of [27]).
(C) The initial response to addition (removal) of attractant increases (decreases) with increasing change in attractant concentration. Adaptation times for attractant addition are longer than that for removal as observed [17].
(D) For step inputs, normalized peak activity of the model (1 – ΔA/Ass, where ΔA is the change in activity from steady-state level Ass) exhibits sensitivity to the size of the step (red line with dots is a guide to the eye). This sensitivity response closely matches data from the “small lattice” model of [36] (blue line with triangles is a fitted sigmoid function). The blue dashed line indicates experimental data from [27] as plotted in Figure 4 of [36] (MeAsp input concentration of [27] is adjusted to that of aspartate that yields an equivalent receptor occupancy). As discussed in [36], the nonzero baseline of our model for large step inputs is due to a fraction of receptors in the cluster always having a nonzero probability of being active.
(E,F) Frequency responses of the E. coli signaling network model and the model from [17], linearized about a ligand input of L 0 = 1 μM, reveal low-pass characteristics consistent with observations in [27].

