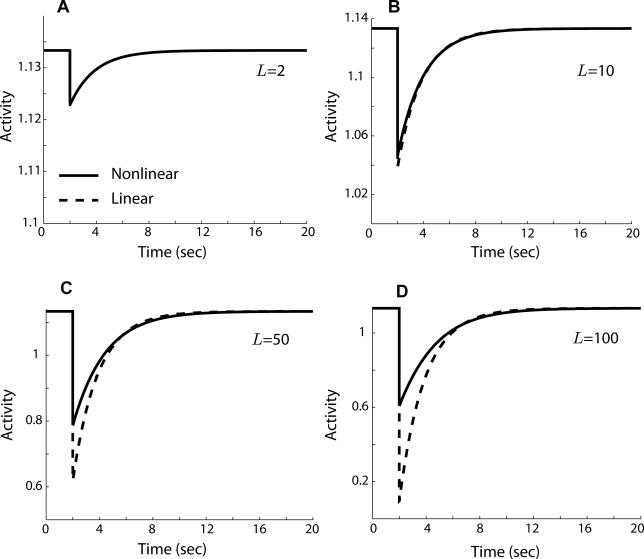
Figure 10. Step Response of the Linearized Signaling Network.
Comparison of the step response of the E. coli signaling network model to the response of the linearized form of the model shows that the linearization is valid for even moderately large step changes in attractant. Response shown is for a step ligand change from L = 1 μM to L = 2 μM (A), 10 μM (B), 50 μM (C), and 100 μM (D), with the linearization about the ligand value L 0 = 1 μM. Model parameters are the same as in Figure 9.

