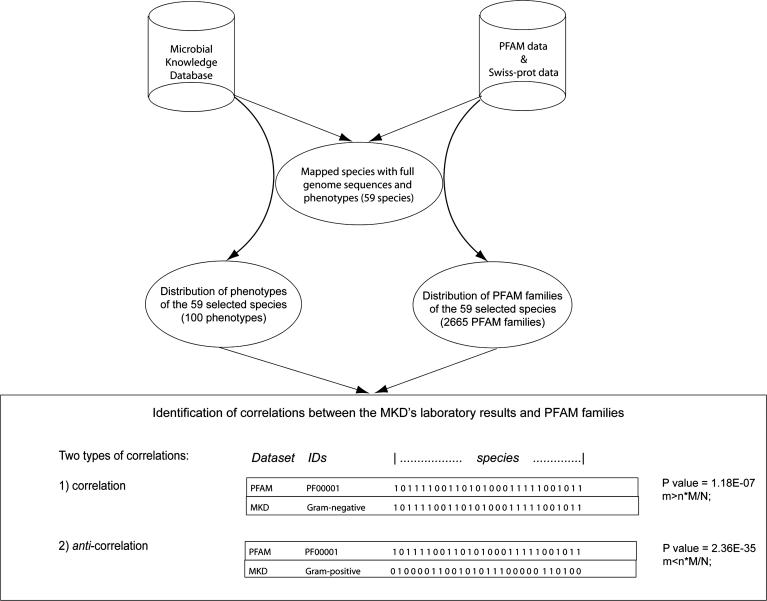
Figure 2. Procedure of Data Integration for Correlating Phenotypes with Pfam Families.
This flowchart shows how the datasets have been integrated. The calculation of correlations between phenotypes and Pfam families is illustrated in the framed area at the bottom. The formula presented in the box is derived from the hypergeometric distribution and allows for a differentiation between correlation and anti-correlation.
N, the total number of species used in the study (59); M, the number of species that have a specific Pfam family, such as PF00001 illustrated; n, the number of species that have a specific phenotype, such as Gram-negative; m, the number of species that have both a specific Pfam family and a specific phenotype.

