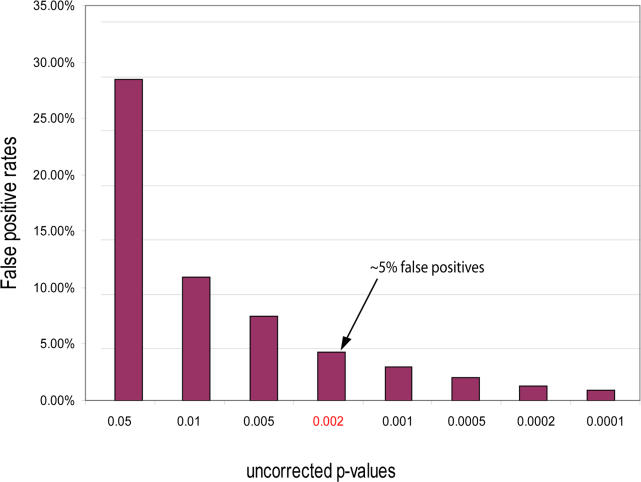
Figure 3. False Positive Error Rates Predicted from Random Datasets According to the Uncorrected Hypergeometric Distribution.
The false positive error rate represents the ratio of the number of significant correlations from the randomized dataset (control experiment) to the number of significant correlations from the real dataset below a certain p-value. At different p-value cutoffs, we calculated the error rates from a sample of 1,000 random permutations of the relationship vectors within the dataset (permutation resampling method), and the cutoffs for the highest 1% of occurrences for each uncorrected p-value of the hypergeometric distribution (data presented). For uncorrected p-values of 0.002 or less, the correlations between phenotypes and Pfam families are predicted to have an error rate of approximately 5%. This cutoff is applied in this study to identify significant correlations.

