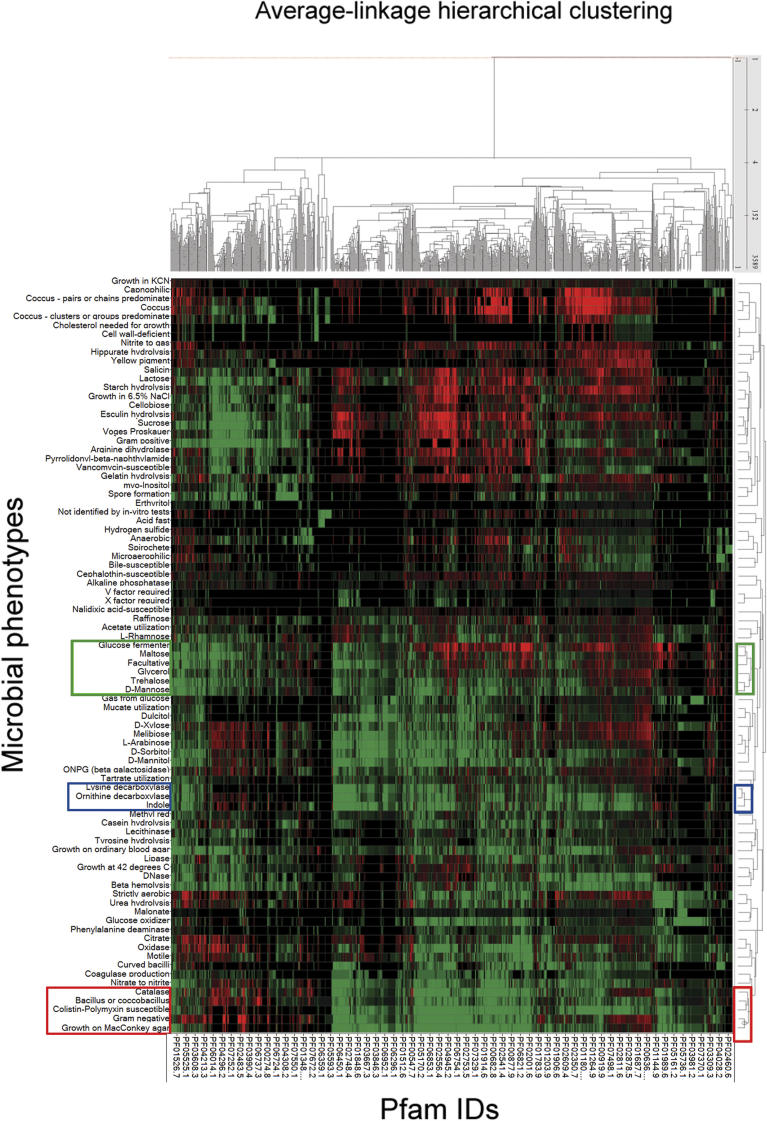
Figure 4. 2-D Hierarchical Clustering of Bacterial Phenotypes and Protein Families.
Phenotypes are on the x-axis and Pfam families are on the y-axis. Correlation is represented in green, and red represents anti-correlation. The three clusters of laboratory tests that are discussed in the paper are highlighted (cluster 1 in a red box; cluster 2 in blue, and cluster 3 in green). We applied continuous coloring representing uncorrected p-values from 0 to 10−4 (red for anti-correlations with the value of −log(p-value) for color intensity, and green for correlations with the value of log(p-value) for color intensity) for displaying purposes. For details on the hierarchical clustering, see Equation 4 in Materials and Methods.

