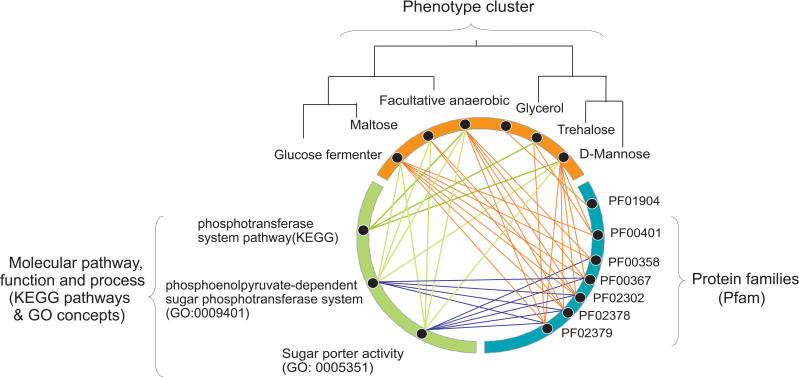
Figure 5. Scalar Network of Correlated Phenotypes, GO, Pathways, and Protein Families.
As predicted by our study, six phenotypes, taken from a phenotypic cluster in Figure 4 (highlighted there in a green box) are shown highly connected with their significantly correlated biological scales: KEGG pathways, GO concepts, and Pfam families. Every relationship (orange and green lines between concept nodes) has been derived from our study with the exception of relationships between GO and Pfam (blue lines) that were taken from public databases.
D-mannose, acid production in a medium containing D-mannose; Facultative anaerobic, facultative anaerobic organism; Glucose fermenter, fermentation in a glucose medium; Glycerol, acid production in a medium containing glycerol; Maltose, acid production in a medium containing maltose; Trehalose, acid production in a medium containing trehalose; PF01904, unknown function; PF00401, ATP Synthase; PF00358, Phosphoenopyruvate-dependent sugar PTS (EIIA 1); PF00367, PTS (EIIB); PF02302, PTS Lactose/Cellobiose specific IIB subunit; PF02378, PTS (EIIC); PF02379, PTS system Fructose-specific IIB subunit.

