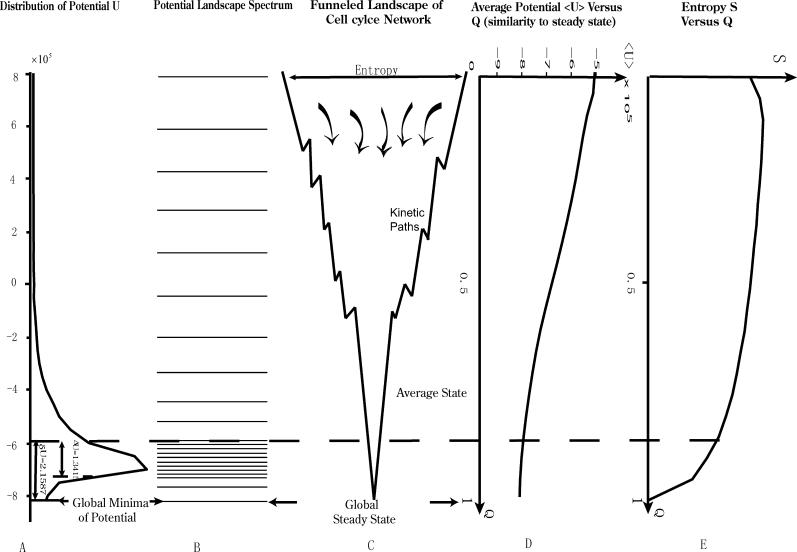
Figure 2. The Global Structures and Properties of the Underlying Potential Landscape of the Yeast Cell–Cycle Network.
(A) The histogram or the distribution of the potential U.
(B) The potential landscape spectrum.
(C) The funnelled landscape of the yeast cell–cycle network.
(D) The averaged potential as a function of similarity parameter Q with respect to the global minimum G1 state (or global steady state) of potential U.
(E) The entropy as a function of similarity order parameter Q with respect to the global minimum G1 state (or global steady state) of the potential U.

