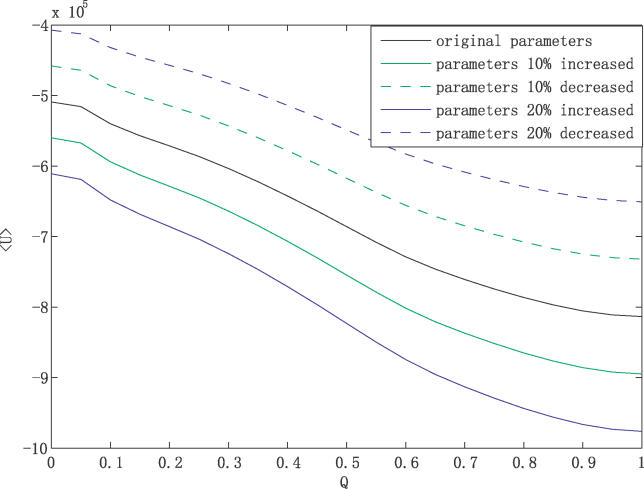
Figure 5. Thermodynamic Phase Diagram for the Yeast Cell–Cycle Network.
Native phase with global minimum G0/G1 state or steady state; non-native phase with states less overlapping with global minimum G0/G1 state or steady state; trapping phase with states trapped into the local minimum. The larger of δU/T and smaller of ΔU/T, or the larger δU/ΔU, the more likely the global minimum G1 state is thermodynamically stable and robust.

