
Figure 2.
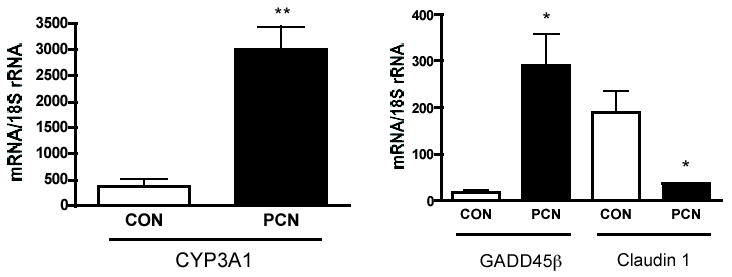
Validation by TaqMan quantitative RT-PCR of selected genes that were altered in the livers of PCN-treated animals. Expression of CYP3A1, GADD45β, and Claudin 1 was determined by quantitative RT-PCR. Data are presented as the mean ± standard deviation of the level of specific gene mRNA expression per 18S ribosomal mRNA as described in “Materials and Methods.” Quantitative RT-PCR was performed on RNA from 5 control and 5 PCN-treated animals (CYP3A1, left graph) and 3 control and 3 PCN-treated animals (GADD45β and Claudin 1, right graph) (the same RNA preparations used for the microarray) and using primers specific to the CYP3A1 sequence (also referred to as CYP3A23, accession no. X96721), GADD45β sequence (NM_001008321), and Claudin 1 sequence (NM_031699). P< 0.05* and P< 0.001** compared to control animals with unpaired t test.