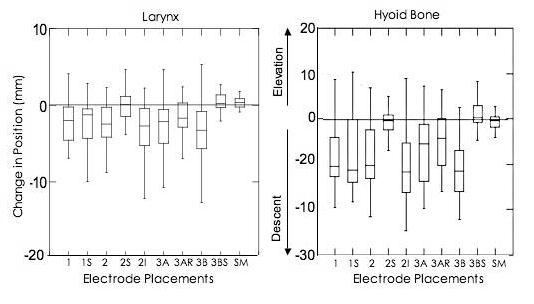
Figure 3.

shows the distribution of change in laryngeal and hyoid bone vertical position (mm) during stimulation at rest by electrode placement using box plots. The first and second quartiles are shown in boxes with the median (line) separating them. The third and fourth quartiles are shown in lines extending from each end of the boxes (first and second quartiles). Data above zero indicate elevation and data below indicate descent, with a trend present when three quarters of the data are on one side of zero.
