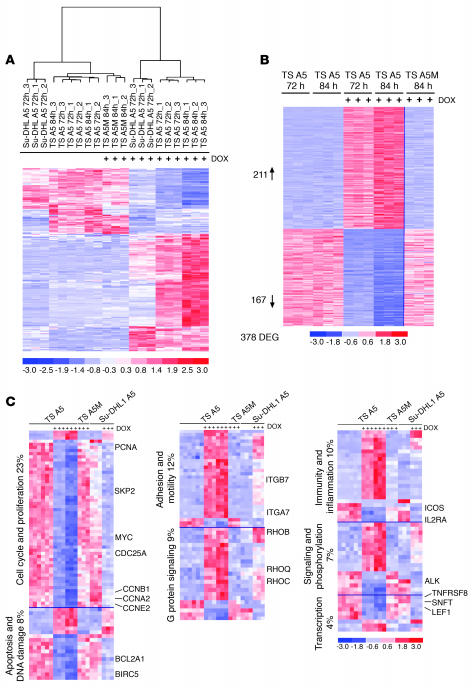
Figure 2. NPM-ALK gene expression signature in ALCL cells derived by inducible shRNA.
(A) GEP differentiates ALCL cells based on ALK expression. Unsupervised analysis of TS-TTA-A5, TS-TTA-A5M, and Su-DHL1-TTA-A5 cells untreated or treated with DOX for the indicated times. In the matrix, each column represents a sample, and each row a gene. The 21 samples were grouped according to the expression levels of the 267 most variable genes, after removal of the signals whose expression levels did not vary across experimental conditions. The color scale bar represents relative gene expression changes, normalized by the standard deviation. (B) The supervised analysis identified a selected number of genes specifically modified in untreated versus treated TS-TTA-A5 cells. Cell samples were cultured with (n = 6) and without (n = 6) DOX for the indicated times. The expression pattern of the identified genes in TS-TTA-A5M cells treated with DOX (84 hours) is shown on the right side. DEG, differentially expressed genes. (C) Functional stratification of ALK-regulated genes. Genes differentially expressed in TS-TTA-A5 treated with DOX were grouped according to their functional categories.

