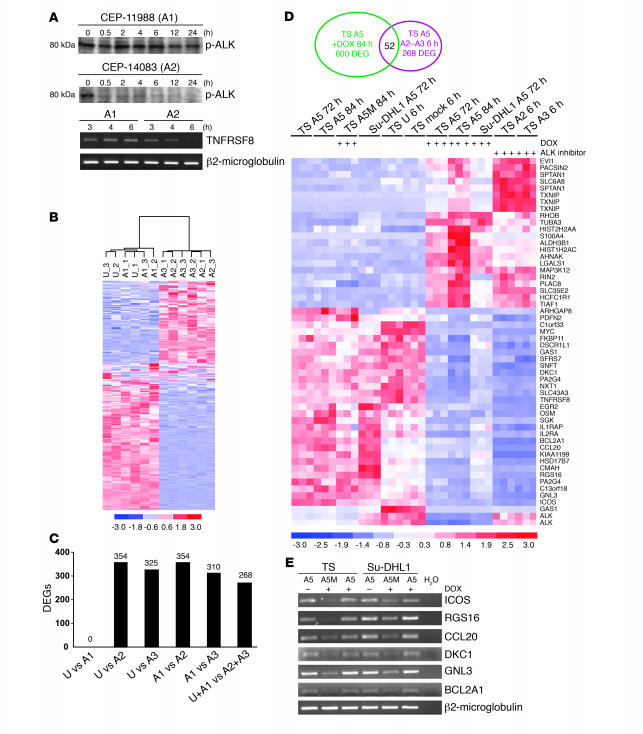
Figure 3. Generation and validation of a restricted signature for ALK-positive ALCL cells.
(A) Kinetics of NPM-ALK dephosphorylation and CD30 (TNFRSF8) downregulation determined by ALK inhibitors. ALK-positive cells were treated (300 nM) with A1 (CEP-11988) or A2 (CEP-14083) as indicated. ALK phosphorylation was assayed using a specific phospho-ALK (Y1604) antibody (upper panels). Levels of TNFRSF8 and β2-microglobulin mRNA were analyzed by semiquantitative RT-PCR (lower panels). (B) Gene expression profiling differentiates ALCL cells based on ALK activity. Unsupervised analysis of TS-TTA-A5 cells after no treatment (U) or treatment with A1, A2, or A3 (CEP-14513) ALK inhibitors (6 hours). In the matrix, each column represents a sample and each row a gene. The 12 samples were grouped in the dendrogram according to the expression levels of the 320 most variable genes. (C) ALK inhibitors modulate a similar set of genes. Number of genes differentially expressed in TS-TTA-A5 following ALK kinase inhibition as determined by supervised analysis for the indicated conditions. (D) Eisen plot of the expression values of 52 transcripts consistently modulated across shRNA- and ALK inhibitor-treated TS-TTA-A5 cells. (E) RT-PCR validation of NPM-ALK signature. A5- or A5M-transduced TS-TTA and Su-DHL1-TTA cells were treated with DOX for 72 hours, and mRNA expression for 6 genes (ICOS, RGS16, CCL20, DKC1, GNL3, BCL2A1) was determined by semiquantitative RT-PCR.

