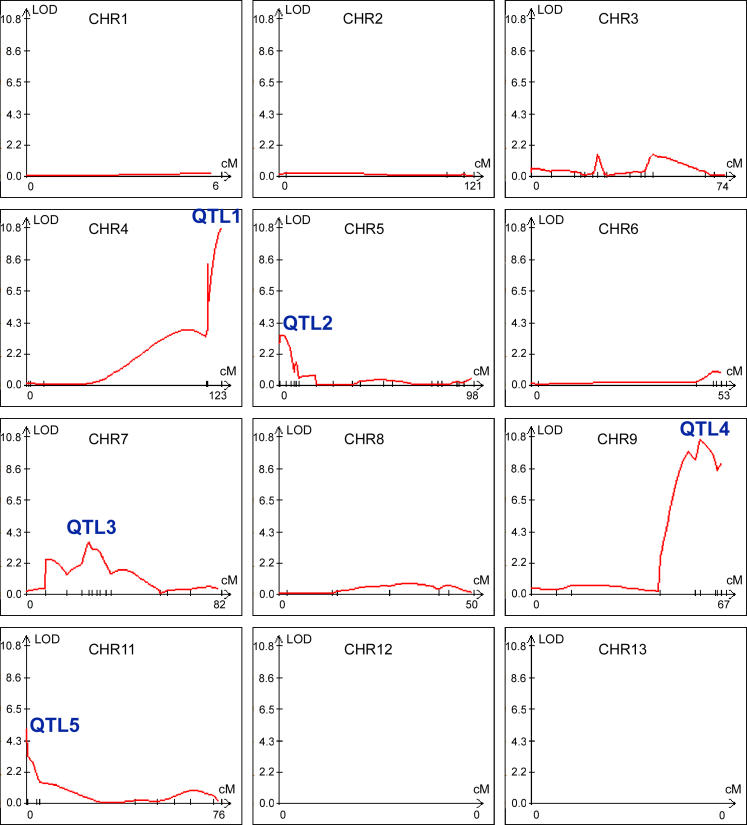
Figure 5. Five Significant QTLs Influence the Variation of Hyphal Elongation.
Analysis by WinQTL using the CIM method is shown. The y-axis shows the LOD score and the x-axis shows the marker location on each chromosome. Five QTLs with a LOD score greater than the threshold 3.2 are labeled. Chromosome 14 is not depicted, as no QTL was identified on this chromosome.

