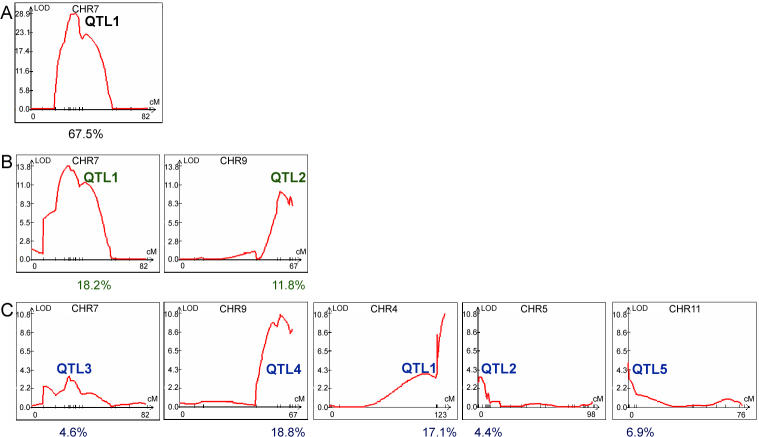
Figure 9. Application of QTL Mapping to Melanin Production and Growth at 39 °C.
The averaged scores obtained from three independent replicates for melanin production and growth at 39 °C were used as trait values and applied in the WinQTL program. Profiles obtained by CIM are shown. One QTL on Chromosome 7 was identified as responsible for variation in melanin production (A) and two QTLs on Chromosomes 7 and 9 as responsible for growth sensitivity to 39 °C were identified consistently by single marker analysis, IM, CIM, and MIM (B). Other chromosomes without any significant QTL are not shown. Five QTLs responsible for variation of hyphal growth located on Chromosomes 7, 9, 4, 5, and 11 are also shown for comparison (C). The numbers below indicate the percentage of variation accounted for by the corresponding QTLs above according to CIM analyses. LOD threshold for melanin, temperature sensitivity, and filamentation was 7.1, 3.3, and 3.2 respectively.

