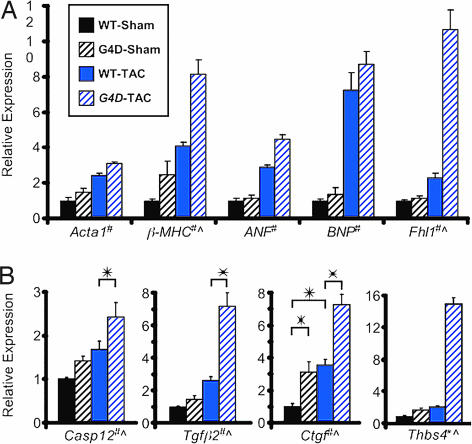
Fig. 5.
Gene expression analysis. Expression was determined by qRT-PCR (for BNP, Fhl1, Casp12, Tgfβ2, and Ctgf) or by Affymetrix microarray. (A) Relative expression of hypertrophy marker genes. Number of samples per group: WT-Sham, 4; G4D-Sham, 4; WT-Band, 6; G4D-TAC,6. (B) Relative expression of fibrosis and apoptosis associated genes. #, P < 0.001 for effect of operation type. ^, P < 0.001 for effect of genotype. ∗, P < 0.01 for pairwise comparisons.

