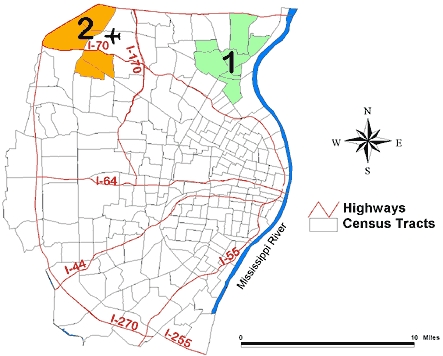
Figure 5.

Geographic clustering of fast food restaurants adjusted for racial distribution and poverty rate by census tract in the St Louis, Mo, study area. The ratio of observed to expected number of restaurants in Cluster 1 is 0.07 (P = .004); Cluster 2, 3.1 (P = .001).
