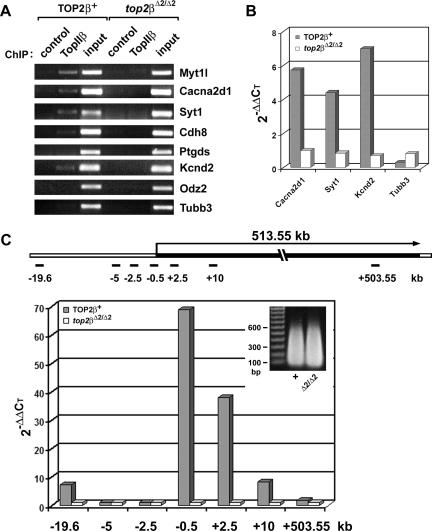
FIG. 6.
ChIP analysis of TopIIβ binding to TopIIβ-sensitive genes. (A) ChIP analysis using PCR. ChIP analysis using anti-TopIIβ antibody was performed on sheared chromatin (<4 kb) isolated from E18.5 brains of both TOP2β+ (two Top2β+/+ and three top2β+/Δ2 brains combined) and null mutant (top2βΔ2/Δ2) embryos. The ChIP products were PCR amplified using primer sets corresponding to the promoter regions of various genes (Myt1l, Cacna2d1, Syt1, Cdh8, Ptgds, Kcnd2, Odz2, and Tubb3) as described in Materials and Methods. For control samples, no antibody was added during ChIP. (B) ChIP analysis using quantitative real-time PCR. Quantitative real-time PCR was performed on the same ChIP products (described for panel A) using the same primer sets corresponding to the promoter regions of Cacna2d1, Syt1, Kcnd2, and Tubb3. Data were analyzed using the SDS 2.2 software. The threshold cycle value for each sample was chosen from the linear range. The relative amount of DNA in the ChIP product was calculated with the use of the 2−ΔΔCT method (32), using “input” as the normalization standard for each sample and the “control” as the baseline. (C) TopIIβ binding to the transcription unit of the Kcnd2 gene. Quantitative real-time PCR was performed on ChIP products as described for panel B, except that the ChIP was performed on sheared chromatin with an average size of 300 bp (insert) and the primer sets covering different regions of the Kcnd2 gene (see the schematic representation of the 513.55-kb transcription unit of the Kcnd2 gene) were used.

