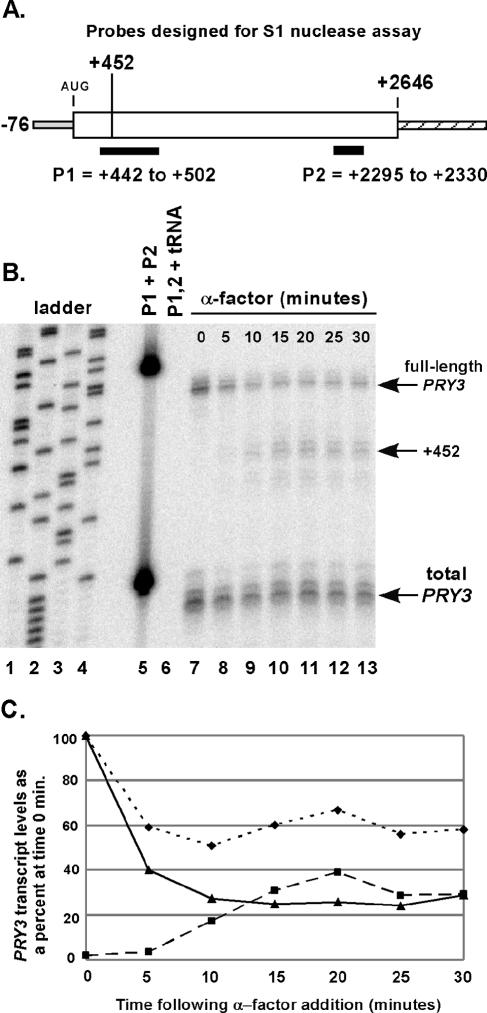
FIG. 2.
Kinetics of alteration in PRY3 transcript structure during an α-factor time course. (A) Oligonucleotide probes for S1 nuclease assay were designed as shown, with an additional five bases of nonhomologous sequence at the 5′ end of the probe to control for S1 nuclease activity. (B) Total RNA was isolated from wild-type cells treated or not treated with α-factor for the indicated times. Probe hybridization was performed with a mix of both probes, followed by S1 nuclease digestion (see Materials and Methods). A sequencing reaction from pBSII SK(+) plasmid generated the base pair ladder (lanes 1 to 4). Lane 5 is the mixture of the two probes with no S1 added during the experiment. Lane 6 is the probe mixture hybridized to tRNA (50 μg) as a digestion control. These data are representative of five independent experiments. (C) Levels of full-length transcript (solid line with triangles) and +452 transcript (dashed line with squares) were quantified from the S1 nuclease assay in panel B. Values for both are shown as a percentage of the intensity of the full-length transcript at 0 min. Total PRY3 levels (dotted line with diamonds) are the P2 probe quantities for the α-factor time course plotted as percentage of the total transcript at 0 min.

