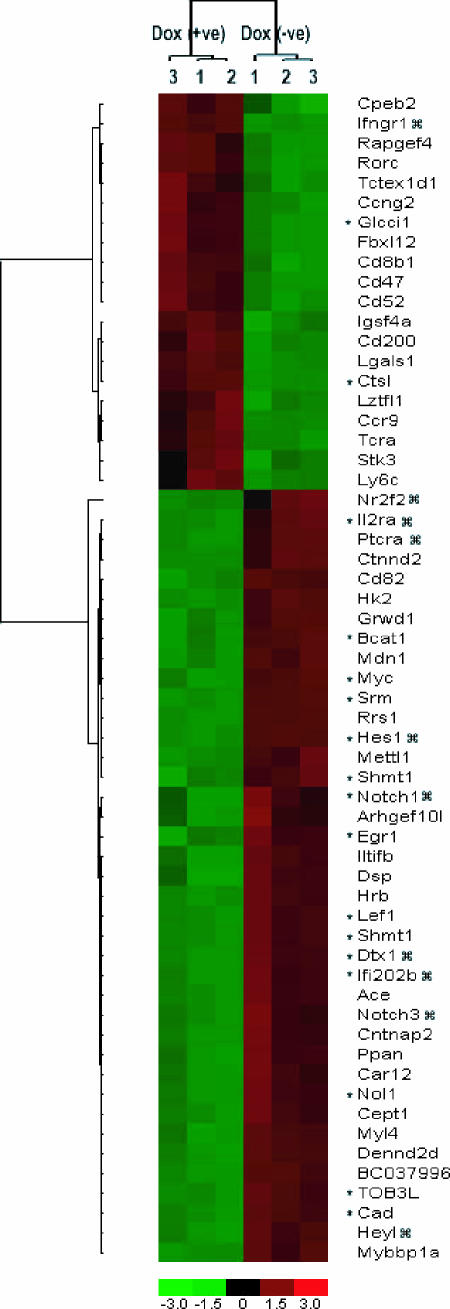
FIG. 4.
Notch1-regulated genes in mouse T-ALL. Shown is a heat map of clustered samples in columns and clustered genes in rows of expression data of mouse leukemic cell line 3404 cultured in the presence or absence of doxycycline or Notch1IC. The pseudocolor representation of gene expression ratios is shown with the scale below. The hierarchical clustering was performed for genes having a change of more than twofold (P value of 0.005). NotchIC target genes are indicated by  ; c-myc target genes are indicated by an asterisk.

