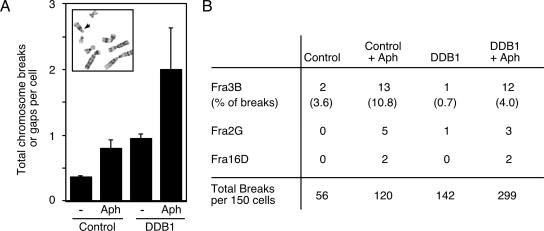
FIG. 8.
Depletion of DDB1 enhances chromosome breaks. (A) U2OS cells were transfected with control or DDB1 siRNA oligonucleotides and processed for metaphase spread analysis 3 days after transfection. Fragile sites were induced by the addition of 0.1 μM aphidicolin (Aph) 24 h prior to harvest. Identification of chromosome gaps and breaks was facilitated by trypsin-Giemsa banding, as shown in the inset. The arrowhead indicates the location of a chromosome break. The graph depicts the average number of chromosome gaps or breaks per cell. (B) The chromosome location of the gaps and breaks was recorded based on banding patterns. FRA3B, FRA2G, and FRA16D breakages were scored as described previously (48).

