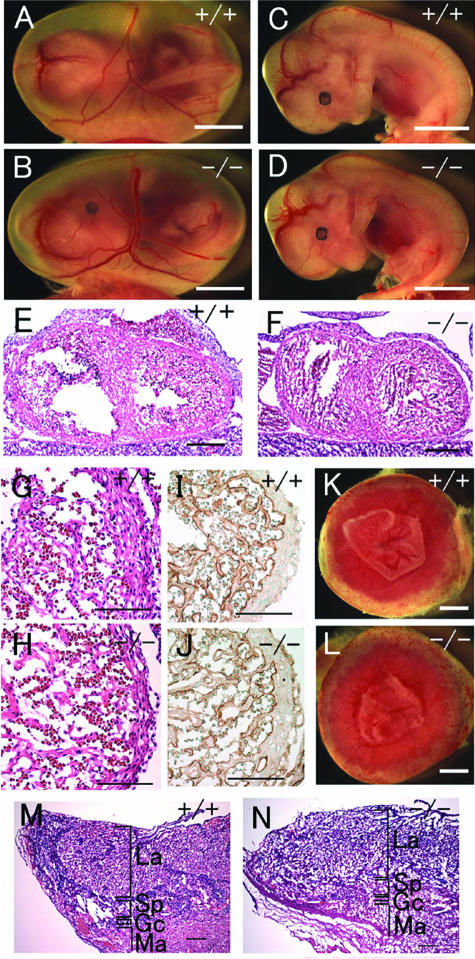
FIG. 9.
Morphological analysis of Phd3−/− embryos and placentas at E12.5. (A and B) Embryos with yolk sacs. (C and D) Embryos after removal of yolk sacs. (E and F) HE-stained frontal heart sections. (G and H) Heart sections at higher magnifications. (I and J) Anti-PECAM-1 IHC staining of heart sections. (K to N) External appearances (K and L) and HE-stained sections of Phd3+/+ and Phd3−/− placentas. No obvious differences can be found. Scale bars, 2 mm (A to D), 250 μm (E and F), 125 μm (G to J), 1 mm (K and L), and 250 μm (M and N).

