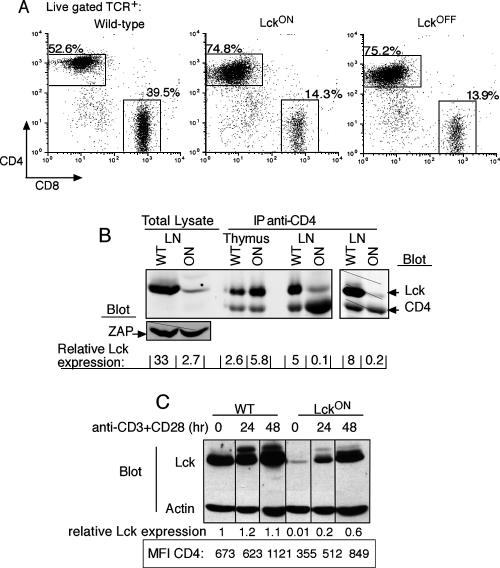
FIG. 1.
Expression of the Lck1 transgene in Lck1ind mice is upregulated following activation. (A) CD4 and CD8 expression on gated live TCRhi cells from LNs of WT and Lck1ind mice on DOX (LckON) or off DOX (LckOFF) (1 to 2 weeks). (B) Cell lysates were prepared from LNs and analyzed by Western blot analysis for Lck and ZAP-70 as a loading control. CD4 was immunoprecipitated from the thymus and LN, and blots were probed for Lck and CD4. Relative Lck expression levels were determined by normalizing data to those for ZAP-70 or CD4. As the CD4-associated Lck was greatly reduced in Lckind mice, samples were loaded to maximize the Lck signal, and the right panel shows the loading controls for immunoprecipitates from equivalent cell numbers. Quantitation was by infrared imaging using the Li-Cor Odyssey system. (C) LN cells were stimulated with 1 μg/ml CD3 and 1 μg/ml CD28 for 24 and 48 h. Cell lysates were blotted with anti-Lck and antiactin and visualized by chemiluminescence. Relative Lck expression levels were normalized to data for actin, and the unstimulated WT value was set to 1. The CD4 MFIs are presented for comparison.

