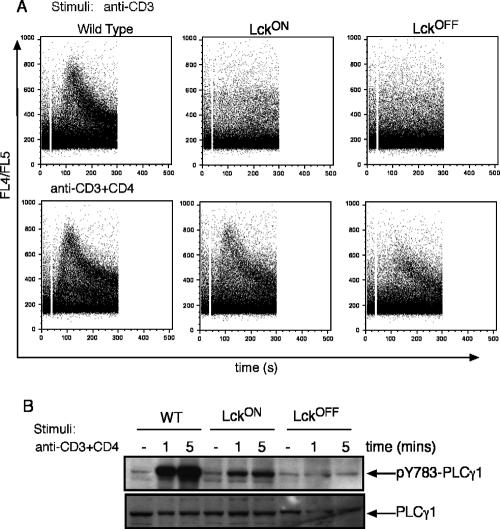
FIG. 2.
Defective Ca2+ and PLC-γ1 phosphorylation in LckOFF T cells. (A) LN cells were loaded with indo-1 and stimulated with cross-linked anti-CD3 or anti-CD3 plus anti-CD4. FACS plots show the ratios of indo-1 fluorescence against time for CD4 cells. (B) Purified CD4+ T cells were stimulated as shown and blotted with anti-PLC-γ1 pY783 or total anti-PLC-γ1 for loading and visualized by chemiluminescence. Data shown are representative of at least three experiments. Percent relative expression was calculated by densitometric analysis of bands and normalizing data for individual phospho bands to those for their loading controls, and the maximal signal was set to 100%.

