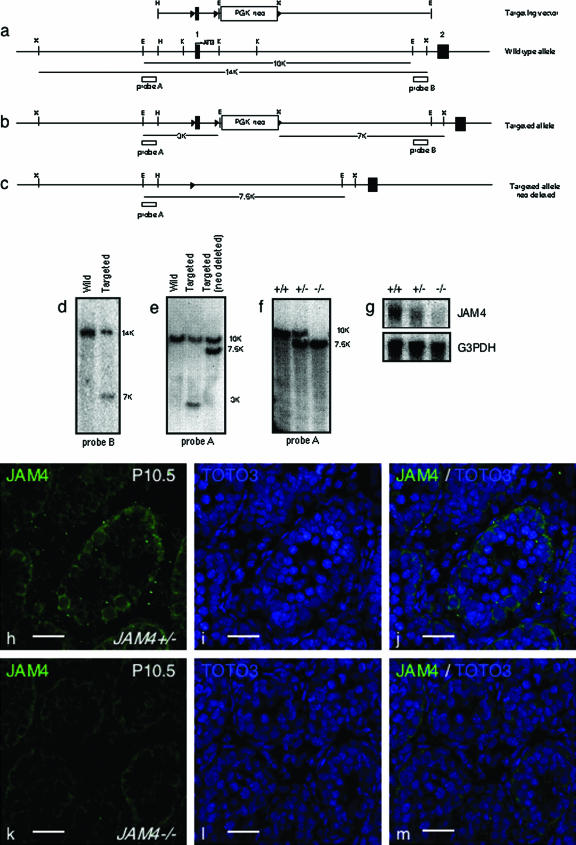
FIG. 3.
Targeted disruption of mouse JAM4 gene. (a) Structure of the targeting vector and JAM4 gene locus. Filled rectangles represent exons, and open triangles represent loxP sites. Probe A and probe B used in Southern blot analysis are shown as boxes. E, EcoRI; X, XbaI; H, HindIII; and K, KpnI; these are restriction sites. (b) Targeted allele before Cre-mediated recombination of loxP sites. (c) Targeted allele after Cre-mediated recombination resulting in deletion of the gene fragment containing JAM4 exon 1 and the PGK-neo cassette. (d) Southern blot analysis of wild-type ES cells and the targeted clone. We obtained seven clones that showed successful recombination at this step. The representative data (clone no. 190f) is shown. The 14-kb wild-type allele and the 7-kb targeted allele XbaI fragments identified by external probe B are shown. (e) Southern blot analysis of the wild-type allele, the targeted allele before Cre-mediated recombination, and the targeted allele after Cre-mediated recombination. We chose two individual clones to treat with Cre. After the Cre treatment, we obtained two clones from each parent clone that was successfully deleted of exon 1 and a part of intron 1. The representative data (clone no. 190f20) are shown. The DNA samples were digested with EcoRI. The 10-kb wild-type and the 3-kb targeted allele before Cre-mediated recombination as well as the 7.5-kb targeted allele after Cre-mediated recombination identified by external probe A are shown. (f) JAM4-deficient mice from clone 190f20d were used for further analysis. Southern blot analysis of tail genomic DNA from wild-type (+/+), heterozygous (+/−), and homozygous (−/−) mice using probe A. (g) Northern blot analysis of mice of the indicated genotypes. JAM4 expression was completely abolished in JAM4−/− mice. (h to m) Immunohistological analysis of JAM4 in P10.5 testis from JAM4 heterozygotes (+/−) and homozygotes (−/−). JAM4 (h and k), TOTO3 (i and l), and merged images (j and m) are shown. Scale bars, 25 μm (h to m).

