FIG. 4.
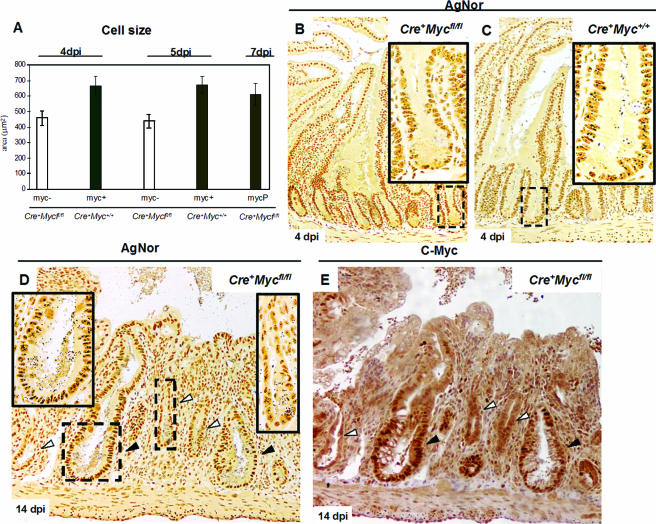
Size and biosynthetic capacity are reduced in c-Myc-deficient cells. (A) Graph summarizing cell size reduction in c-Myc-deficient cells (myc-). Data were analyzed at two time points after induction, and similar results were obtained (Cre+Mycfl/fl, 459 ± 46 μm2, 4 days p.i. [dpi]; Cre+ Myc+/+, 662 ± 61 μm2, 4 days p.i.; Cre+ Mycfl/fl, 437 ± 43 μm2, 5 days p.i.; Cre+ Myc+/+, 672 ± 53 μm2, 5 days p.i., n = 3). The last bar represents the cell size of c-Myc-proficient cells (MycP) of Cre+ Mycfl/fl mice at 7 days p.i. (611 ± 70 μm2; n = 2). Data are means ± standard deviations, and n is the number of mice analyzed per time point. (B) Underrepresentation of AgNor dots, regions of ribosomal gene synthesis, in c-Myc-deficient cells and crypts of Cre+ Mycfl/fl mice at 4 days p.i. (C) Corresponding control Cre+ Myc+/+ mice with multiple large AgNor dots per nucleus. Insets are magnifications of representative squared areas. (D) Sections from Cre+Mycfl/fl mice at 7 days p.i. and incubated with AgNor. Note that at this stage, smaller c-Myc-deficient crypts (white arrows, right-hand magnification inset) clearly have fewer and smaller AgNors compared in the same section with c-Myc-proficient crypts (black arrows, left-hand magnification inset). (E) Consecutive paraffin section stained with c-Myc Ab, showing smaller crypts with fewer AgNors being c-Myc negative (white arrows).

