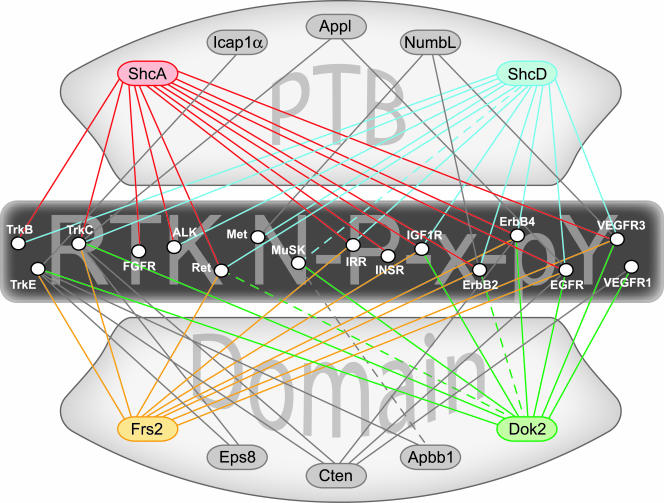
FIG. 8.
Protein interaction maps can be assembled using data obtained from the peptide arrays. Exploiting the in vitro binding data to predict interactions between full-length proteins allows us to connect membrane-bound receptors and putative cytoplasmic adaptors. PTB domain-containing adaptor proteins are indicated at top and bottom, and RTKs bearing one or more NXXY motifs in their cytoplasmic domain are listed across the center. Only the higher-affinity binding reactions with phosphorylated motifs are shown (solid lines). Adaptors showing high connectivity in this network are highlighted with color (ShcA, ShcD, Frs2, and Dok2). The interaction map can be further supplemented with data verifying associations that fell below the affinity threshold, such as the interactions described for ShcD-MuSK, Dok2-ErbB2, and Apbb1-MuSK (dashed lines). ALK, anaplastic lymphoma kinase; EGFR, epidermal growth factor receptor; FGFR, fibroblast growth factor receptor; IGFR, insulin-like growth factor receptor.

