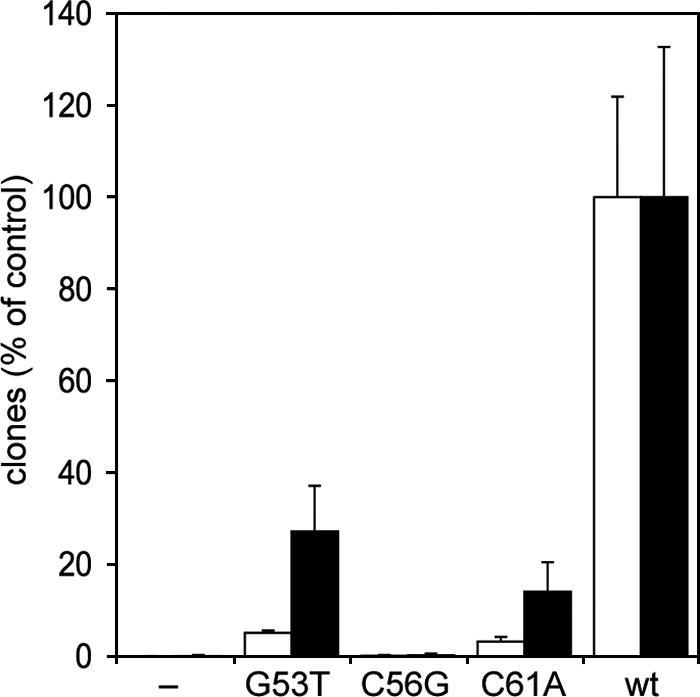
FIG. 6.

TRE integration frequencies at mutant tRNA genes. The figure shows the results of the TRE trap assay with ValUAC (white bars) and Glusup (black bars) as bait tRNA genes. Mutant tRNA genes (as indicated), empty TRE trap (−), and wild-type tRNA genes were tested. Clone numbers from 10 petri dishes of two independent clones of each strain are normalized for the wild-type (wt) tRNA genes and expressed ± SDs.
