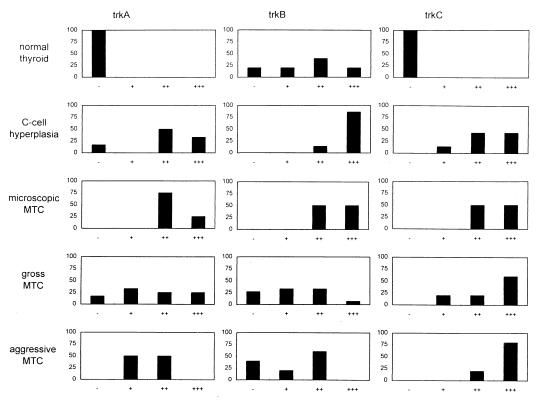
Figure 2.
trk family expression in the progression from normal C cells to MTC. The y-axis for each bar graph indicates the percent of samples in each category (normal thyroid, C cell hyperplasia, microscopic MTC, or gross MTC, as designated to the right of each row), which demonstrated strong (+++), moderate (++), weak (+), or absent (−) staining for each trk family member (as designated at the top of each column). Immunohistochemical staining was seen only for trkB in the 10 normal thyroids examined. Immunohistochemical staining for each trk family member was seen in some of the seven samples of C cell hyperplasia associated with MTC, with trkB having moderate or strong staining in all of the samples. All four microscopic MTC tumors stained moderately or strongly for all three trk family members. Only one gross tumor that was not aggressive stained strongly for trkB, and no aggressive tumor stained strongly for trkB or trkA. In contrast, 53% of gross nonaggressive tumors stained strongly for trkC, and 80% of aggressive tumors stained strongly for trkC.

