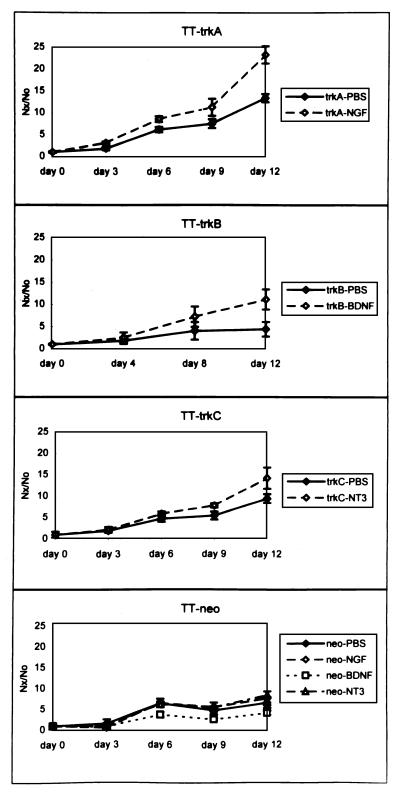
Figure 4.
Growth of the TT cells expressing trk family receptors. Each cell line was grown in media containing the indicated neurotrophin or in media containing an equivalent amount of the neurotrophin solvent, 1× PBS. Each data point represents the number of cells detected at the indicated time point divided by the number of cells detected at day 0 and is an average of several samples tested in at least three independent experiments. The error bars represent plus or minus one standard deviation from the average.

