FIG. 5.
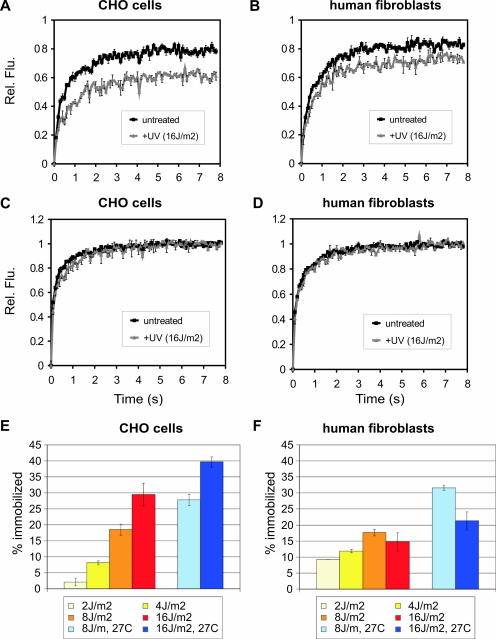
FRAP analysis of UV-treated and untreated cells to visualize DNA damage-dependent immobilization of XPG-eGFP. (A and B) FRAP recovery curves (normalized to prebleach intensity set to 1) for CHO cells and human fibroblasts, respectively. Black curves, XPG-eGFP recovery in untreated cells (as a reference); gray curves, recovery in UV-irradiated cells. Rel. Flu., relative fluorescence. (C and D) FRAP recovery curves (normalized to maximum recovery postbleach, which is set to 1) of XPG-eGFP in CHO cells and human fibroblasts, respectively. Black curves, XPG recovery in untreated cells (as a reference); gray curves, recovery in UV-irradiated cells. (E and F) Immobilized XPG-eGFP fractions in CHO cells and human fibroblasts, respectively, in response to different UV doses. Light blue and dark blue bars depict measurements of cells cultured at 27°C after treatment with 8 and 16 J/m2 UV, respectively. Error bars show the standard errors of the means.

