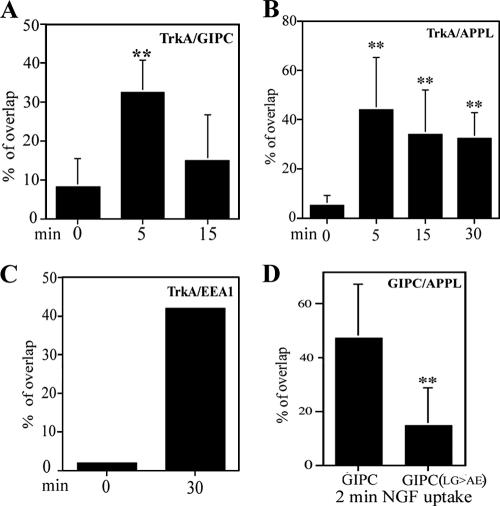
FIG. 3.
Semiquantitative analysis of overlap in distribution between TrkA and GIPC (A), APPL (B), or EEA1 (C) and between GIPC-FLAG or GIPC(LG>AE)-FLAG and APPL (D). Images were thresholded as described in Materials and Methods, and positive pixel areas for TrkA (A to C) and GIPC-FLAG or GIPC(LG>AE)-FLAG (D) that were also positive for the marker (yellow pixels) were measured. PC12(615) cells were incubated with anti-TrkA (A, B, and C) or NGF (D) for the periods indicated and stained for GIPC, APPL, and/or EEA1. (D) Anti-FLAG IgG was used to detect GIPC-FLAG and GIPC(LG>AE)-FLAG. **, P ≤ 0.01.

