FIG. 2.
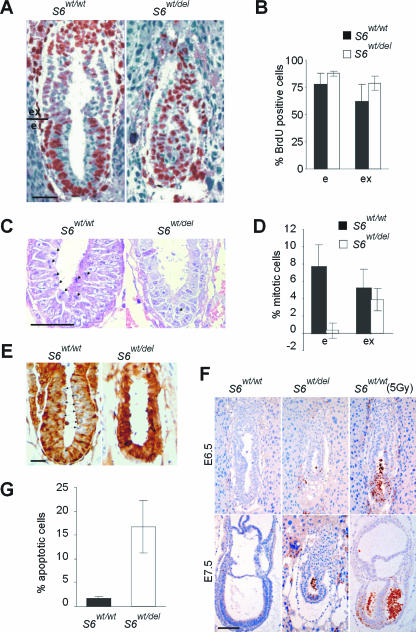
Impaired cellular proliferation and increased apoptosis in S6wt/del embryos. (A) 5-BrdU-labeled cells (brown) in sections of E6.5 S6wt/wt and S6wt/del embryos. (B) Percentage of cells that were BrdU labeled in embryonic and extraembryonic regions of E6.5 S6wt/wt (n = 15) and S6wt/del (n = 13) embryos. (C) Mitotic figures in sections of E6.5 S6wt/wt and S6wt/del embryonic regions are indicated by arrows. (D) Percentage of cells that were in mitosis in embryonic and extraembryonic regions of E6.5 S6wt/wt (n = 12) and S6wt/del (n = 13) embryos. (E) Immunohistochemistry of sections of E6.5 S6wt/wt and S6wt/del embryos with antibodies against phosphorylated Tyr-15-Cdk1. (F) Apoptosis in sections of E6.5 and E7.5 S6wt/wt and S6wt/del embryos. Gamma irradiation (5Gy) induced massive apoptosis in the embryonic part of E6.5 and E7.5 S6wt/wt embryos. (G) Percentages of apoptotic cells in E7.5 S6wt/wt (n = 12) and S6wt/del (n = 10) embryos. e and ex in panels A, B, and D indicate embryonic and extraembryonic regions, respectively. Scale bars, 50 μm (A, C, and E) and 100 μm (F). Error bars in panels B, D, and G denote standard deviations (SD).

