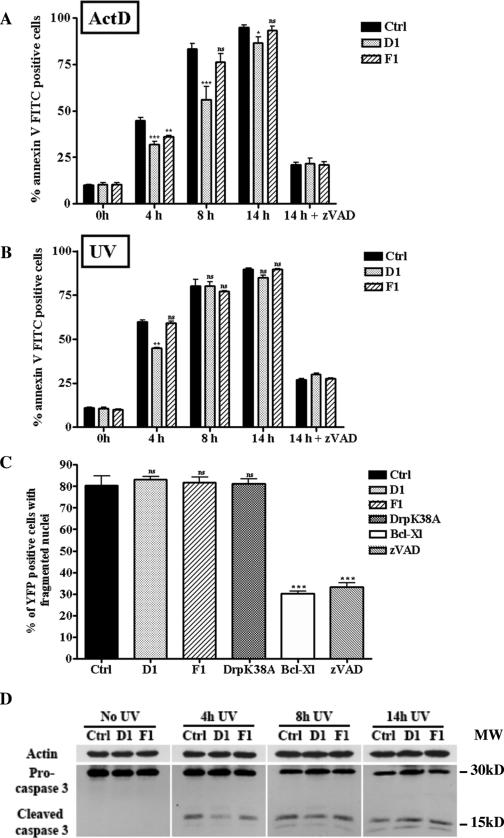
FIG. 4.
Depleting cells of Drp1 or hFis1 does not inhibit apoptosis. (A) HeLa cells were infected with the control (Ctrl), D1, or F1 shRNA retroviruses, grown for 96 h, treated with ActD 3 μM for the indicated times, and stained with annexin V FITC for flow cytometric analysis. The histograms represent a quantitative analysis of the percentage of annexin V FITC-positive cells after induction of apoptosis by ActD in the absence (0 h, 4 h, 8 h, 14 h) or presence (14 h + zVAD-fmk) of the caspase inhibitor zVAD-fmk. The data are expressed as the means + SEMs of the results of three independent experiments.  , P < 0.05;
 , P < 0.005;

 , P < 0.0005; ns, not significant). Panel B presents data obtained as described for panel A except that apoptosis was triggered by UV irradiation.
 , P < 0.005; ns, not significant. (C) Cos-7 cells were cotransfected with pEYFPmito and control, D1, or F1 shRNA constructs or pCiDrpK38A or pCiBcl-Xl; 72 h after transfection, the cells were treated with ActD (6 μM) for 14 h and just before collection the cells were incubated with propidium iodide and Hoechst 33342 for 15 min. The histogram represents a quantitative analysis of the percentage of the propidium iodide-negative Cos-7 cells expressing yellow fluorescent protein (YFP) that displayed apoptotic nuclei as observed by Hoechst 33342 staining. The data are expressed as means + SEMs of the results of three independent experiments.

 , P < 0.0005; ns, not significant. (D) HeLa cells were treated as described for panel B, and the cleavage of caspase-3 was assessed by Western blotting at the indicated times.

