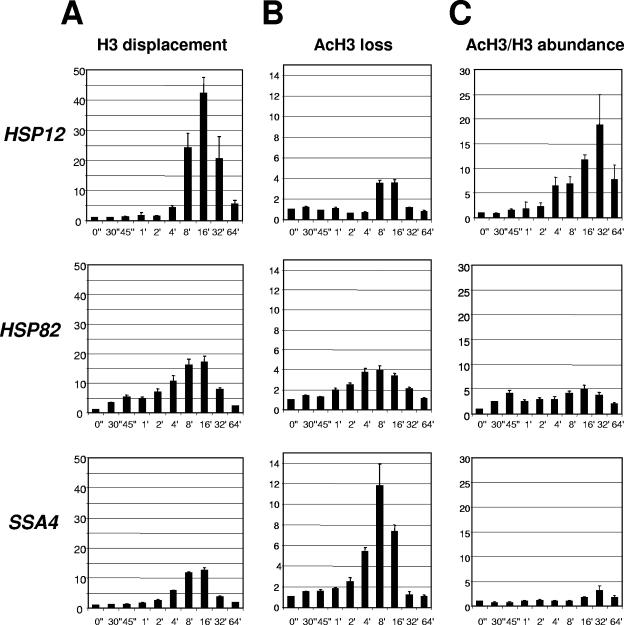
FIG. 1.
Kinetics of histone H3 displacement at heat shock gene promoters. (A) Fold displacement of histone H3 (y axis) over time (0 to 64 min) (x axis) relative to the non-heat-shock level (0"), which was arbitrarily set at 1. All real-time PCR values were normalized relative to the PHO5 promoter, which is known to contain positioned nucleosomes that do not change during heat shock (13). Values represent means ± standard deviations (n ≥ 3). (B) The same experiment as in panel A, except ChIPs were done with antibody raised against the acetylated form of H3. (C) Relative change of acetylated H3 (AcH3)/H3 abundance (y axis), calculated from the data in panels A and B. AcH3/H3 abundance = H3 displacement/AcH3 loss. (Note: the displacement [loss] value is an inverse value of abundance.)

