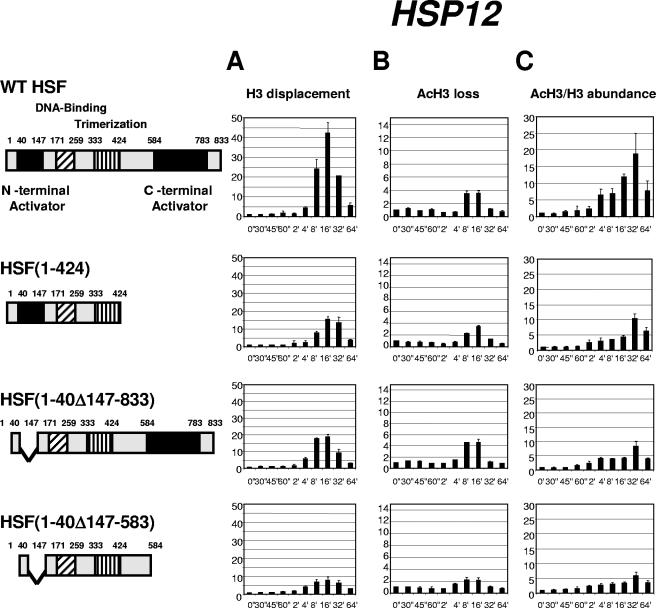
FIG. 3.
Kinetics of chromatin remodeling at the HSP12 promoter in strains expressing different versions of HSF. Data in panels A, B, and C are represented in the same format as in Fig. 1. Cartoons on the left represent maps of the HSF constructs expressed in the four different yeast strains. Note: expression of constructs represents the sole source of HSF.

