FIG.3.
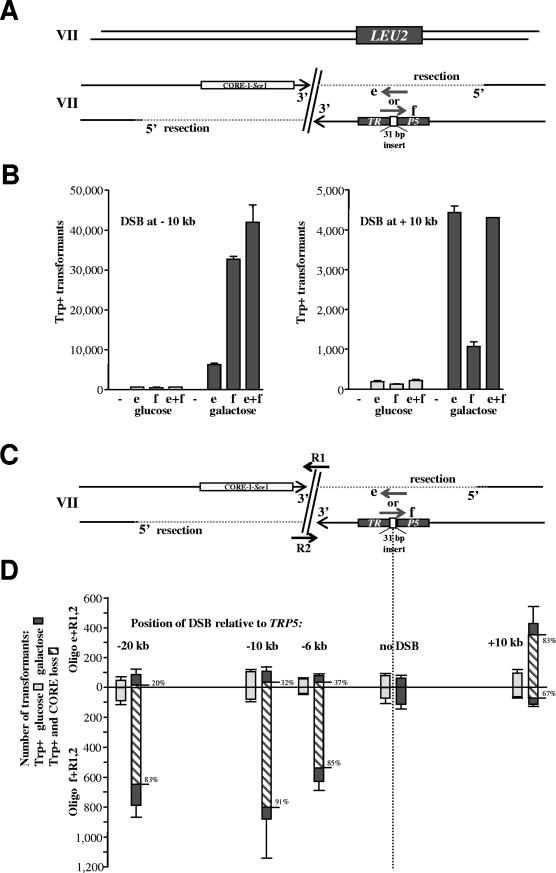
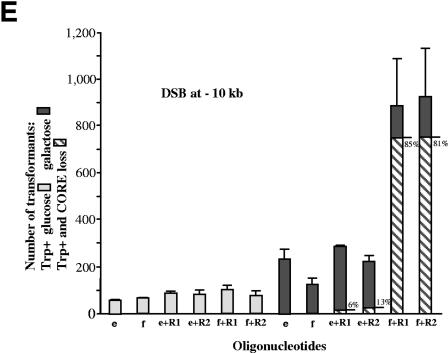
DSB-mediated stimulation of oligonucleotide targeting to the side of the break in a strand-dependent manner. (A) The diagram shows one copy of chromosome VII, where TRP5 has been replaced with the LEU2 gene (Fig. 2). The second copy of chromosome VII contains a TRP5 locus that has been inactivated by a 31-bp frameshift insertion and a CORE-I-SceI cassette that can generate a DSB either 10 kb upstream or 10 kb downstream of the TRP5::ins31 site. The oligonucleotides e and f can restore the Trp+ phenotype. The intact copy of chromosome VII can provide a template for the repair of the DSB as described for the experiments illustrated in Fig. 2. (B) Number of Trp+ transformants per 107 viable cells resulting from targeting 1 nmol of oligonucleotide e or f or both following no DSB induction (light gray bars) or induction of the DSB (7 h in galactose) (dark gray bars) that is either 10 kb upstream or 10 kb downstream from TRP5::ins31. The vertical light and dark gray bars correspond to the average values of three determinations; the ranges (error bars) identify the standard deviations. (C) Scheme to address possible resection and strand bias during targeting of the mutated TRP5 locus that is many kilobases (6, 10, and 20 kb downstream or 10 kb upstream) from an I-SceI-induced DSB in yeast haploid cells. The scheme and oligonucleotides are similar to those in panel A above, with the only difference being that repair oligonucleotides R1 and/or R2 were added to repair the DSB. (D) Number of Trp+ transformants per 107 viable cells resulting from targeting 0.33 nmol of oligonucleotide e or f to TRP5::ins31 with DSB induction (7 h in galactose) (dark gray bars) and without DSB induction (light gray bars) at a position 6, 10, or 20 kb upstream or 10 kb downstream from TRP5::ins31. Also included were 0.33 nmol of the repair oligonucleotide R1 and 0.33 nmol of R2 to repair the induced DSB. The frequency of CORE marker loss events due to the addition of R1 and R2 was about 1% of viable cells when a DSB was induced and ∼0.001% of viable cells in the absence of DSB induction (not shown). The vertical light and dark gray bars correspond to the average values from three to six determinations; the ranges (error bars) identify the standard deviations. The striped bars show the number of Trp+ clones that were without CORE markers, and the percentages of these clones are shown at the right of each bar. Trp+ clones that were without CORE were detected only for cells with a DSB transformed with R1 or R2. (E) Number of Trp+ clones per 107 viable cells resulting from transformation with oligonucleotide e or f (0.5 nmol) alone or together with the repairing oligonucleotide R1 or R2 (0.5 nmol) after cells were grown in glucose (no DSB; light gray bars) or in galactose for 7 h (DSB; dark gray bars). The DSB was generated 10 kb upstream from TRP5::ins31 (see scheme in panel C). The frequency of CORE marker loss due to the addition of R1 or R2 was about 0.3% of viable cells in which a DSB was induced and ∼0.0002% of viable cells in the absence of DSB induction (not shown). The vertical bars correspond to the average values from four determinations; the ranges (error bars) identify the standard deviations. The striped bars show the number of Trp+ clones that were without CORE markers, and the percentages of these clones are shown at the right of each bar. Trp+ clones that were without CORE were detected only for cells with a DSB transformed with R1 or R2.


