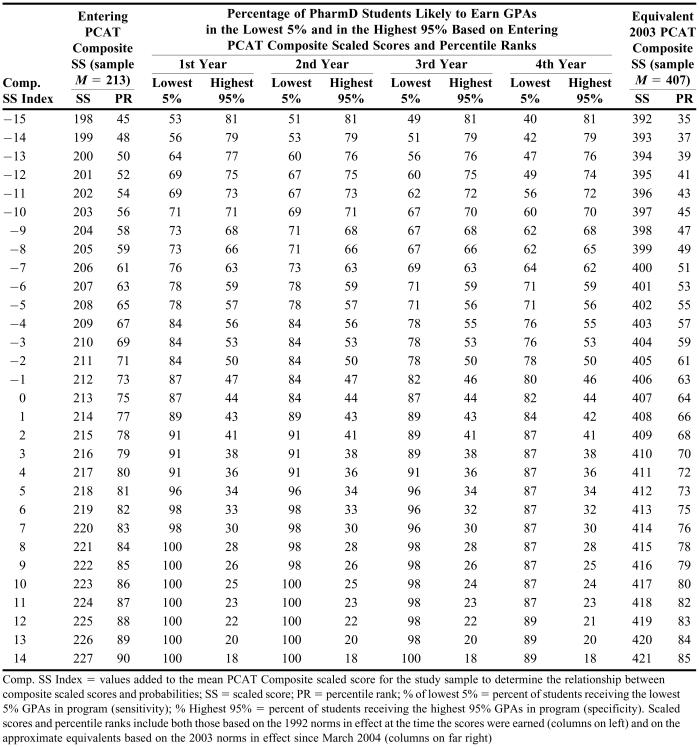
Table 9.
Diagnostic Accuracy for Predicting GPAs in Professional Pharmacy Programs from Entering PCAT Composite Scaled Scores
Comp. SS Index = values added to the mean PCAT Composite scaled score for the study sample to determine the relationship between composite scaled scores and probabilities; SS = scaled score; PR = percentile rank; % of lowest 5% = percent of students receiving the lowest 5% GPAs in program (sensitivity); % Highest 95% = percent of students receiving the highest 95% GPAs in program (specificity). Scaled scores and percentile ranks include both those based on the 1992 norms in effect at the time the scores were earned (columns on left) and on the approximate equivalents based on the 2003 norms in effect since March 2004 (columns on far right)

