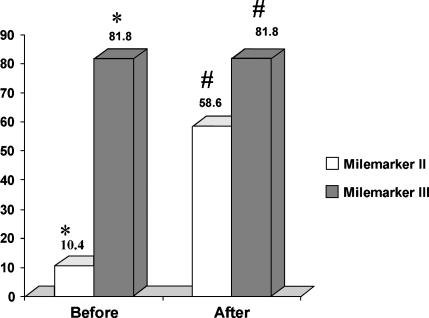
Figure 4.
Comparison of student performance in Milemarker II and Milemarker III, before and after the introduction of incentives in 2003. (* indicates significant difference between groups; t-statistic = 20.4, p < 0.05; # indicates significant difference between groups; t-statistic = 6.6, p < 0.05).

