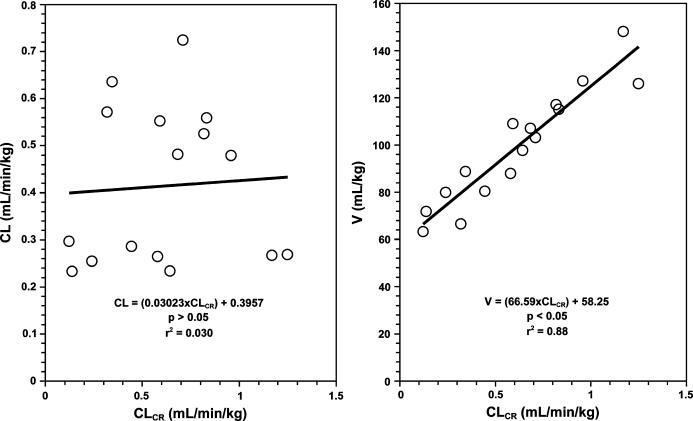
Figure 3.
The relationships between the drug clearance (CL, left panel) or volume of distribution (V, right panel) and the patient creatinine clearance (CLCR) in a small population of sixteen patients for a hypothetical drug. Clearance: CL = (0.0302 × CLCR) +0.396, p > 0.05, r2 = 0.030; Volume of distribution: V = (66.6 × CLCR) +58.2, p < 0.05, r2 = 0.88.

