
Figure 1.
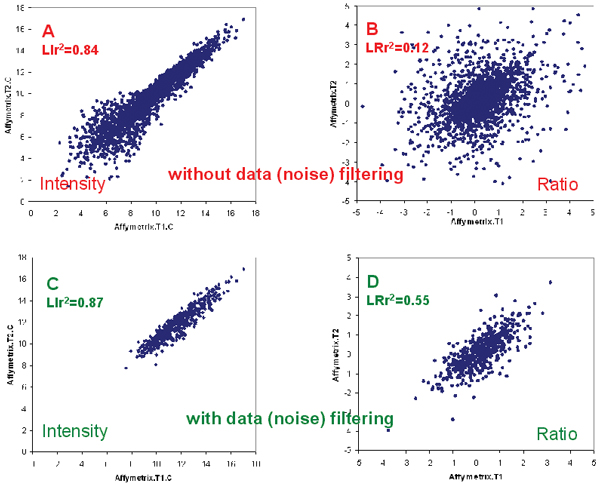
Technical reproducibility. A and C: The log2 intensity correlation of the control samples of technical replicate pairs T1 and T2 before (LIr2 = 0.84) and after (LIr2 = 0.87) data filtering, respectively; B and D: The log2 ratio correlation of the technical replicate pairs T1 and T2 before (LRr2 = 0.12) and after (LRr2 = 0.57) data filtering. Poor intra-platform consistency is more apparent in log ratios.