
Figure 3.
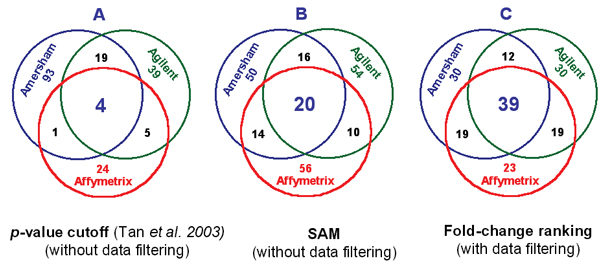
Cross-platform concordance resulting from different data analysis procedures. A: Poor cross-platform concordance (4/185) is reported [11] and cited [5]; B and C: Higher cross-platform concordance was observed by our analysis of the same dataset. For A, the number of selected genes from each platform is determined by the same statistical cutoff (alpha = 0.001), and the number of genes selected is 117, 77, and 34 for the Amersham, Agilent, and Affymetrix platforms, respectively. For B and C, the same number of genes (100) is selected from each platform by SAM (without data filtering) and fold-change ranking (with data filtering), respectively.