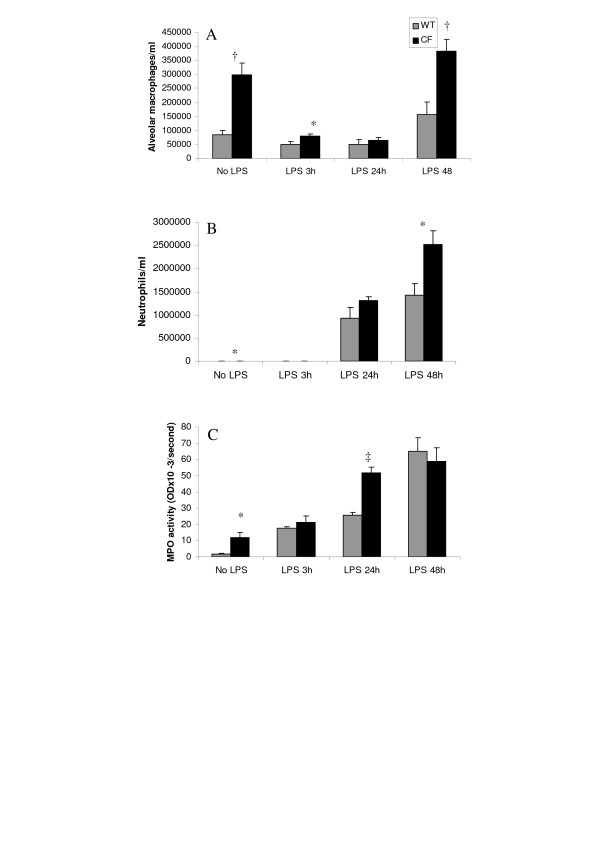
Figure 4.
Time course of cell and tissue components of the inflammatory response in bronchoalveolar lavage fluid obtained 3 h, 24 h and 48 h after intratracheal instillation of P aeruginosa LPS from CF and wild-type (WT) mice. (A) alveolar macrophage counts; (B) neutrophil cell counts; (C) myeloperoxidase (MPO) activity in lung homogenates, expressed as OD × 10-3/second. Values are means ± SEM for 6–9 animals per each of the 8 subgroups. *p < 0.05; †p < 0.01; ‡p < 0.001 for comparison of corresponding mean value vs. that obtained at the same time point in the wild-type group of mice.

