
Figure 5.
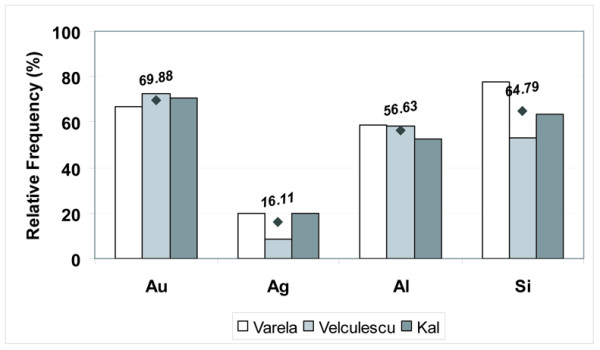
Gain of unambiguous assignments by the HGA method. The percentage of cases where other authors assigned two or more genes to a tag and the HGA method assigned the same experimental tag to a single gene are plotted independently for each tag class and for each publication of SAGE experiments in yeast. White bars correspond to the cumulated data from Var-1, Var-2 and Var-3 experiments [17]; light gray bars correspond to the cumulated data from Vel-1, Vel-2 and Vel-3 experiments [15]; and dark gray bars correspond to the cumulated data from Kal-1 and Kal-2 experiments [16]. In the case of the tags belonging to the class silicon, the HGA method assigned them as mapping to a single intergenic region whereas other authors mapped these tags to those occurrences within annotated transcripts.