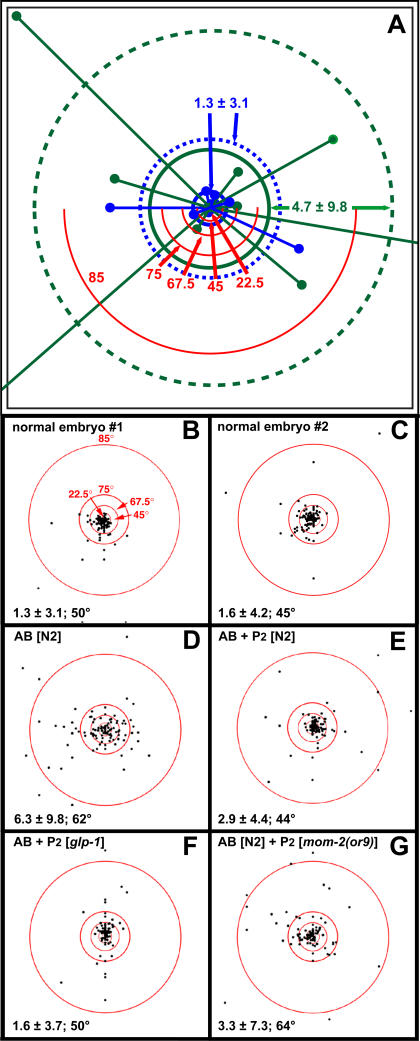
Figure 2. Quantitative Analysis of Cleavage Orientation.
(A) Scheme explaining the quantitative analysis of cleavage orientation using “Löwe projections”. The directions of cell cleavages of all cells are visualised by dots projected on a target screen in which the centre represents the a-p axis. These dots are obtained in the following way: each dividing cell is placed on the a-p axis and a vector is projected from the centre of the mother cell through the centre of the daughter cell. The point where this vector hits a target screen is marked by a dot (the distance between mother cell and screen along the a-p axis is normalised to 1). The red semi-circles represent particular division angles (as indicated). Embryos were analysed from four to 64 AB-derived cells. For statistical analysis, the mean distance of the dots from the target centre and the standard deviation are calculated. This “Löwe value” and its standard deviation give a reasonable measure of the general direction of cell cleavages. This is exemplified by showing nine cleavages of a “polarised” normal embryo (blue) and a “nonpolarised” isolated AB blastomere (green). The mean is indicated by a circle and the standard deviation by a dotted circle. Note that the representation of cleavage angles is not linear, because the distance from the centre to a dot corresponds to the tangent of the cleavage angle to the a-p axis. Thus, angles close to 90 ° cannot be shown on the target screen (here, this is the case for two cleavages of the “nonpolarised” isolated AB blastomere). It becomes obvious that for the normal embryo, in which cells divide mainly along the a-p axis, most dots are located in close proximity to the centre and the corresponding Löwe value is low. In contrast, the dots are widely scattered for the isolated AB blastomere, in which cells do not mainly divide in the a-p direction, and the Löwe value is high.
(B–G) “Löwe projections” of two normal embryos and the embryonic fragments shown in Figure 1A and 1B. The red circles correspond to the red semicircles in (A). In the lower left corner, Löwe values and mean division angles are shown.
(B and C) Normal embryos #1 and #2 from [16,25]. Cells mainly divide in an a-p direction. The Löwe value and especially its standard deviation are low. If a third normal embryo (not shown) is also considered, normal embryos have Löwe values between 1.3 and 1.6 with standard deviations ranging from 3.0 to 4.2. The mean cleavage angles vary between 45 ° and 50 °, the standard deviations between 20 ° and 23 °.
(D) Isolated AB blastomere. Compared to normal embryos (B and C) and AB blastomeres where a P2 blastomere was added (E), the division angles scatter all over the target area; i.e., cells do not mainly divide in the a-p direction. This is reflected in the higher Löwe value and especially the high standard deviation. Five points are off the target screen due to 90 ° divisions.
(E) AB blastomere where P2 was added. Cells mainly divide in the a-p direction, and the Löwe value and its standard deviation decrease noticeably compared to the isolated AB blastomere in (D).
(F) AB blastomere where P2 was added in a glp-1(e2144) background. Again, cells mainly divide in the a-p direction.
(G) Addition of a mom-2(or9) P2 blastomere to a wild-type AB blastomere. Cells do not mainly divide in the a-p direction. The Löwe value is higher than in embryonic fragments dividing mainly in the a-p direction and its standard deviation resembles the standard deviation of the isolated AB blastomere.

