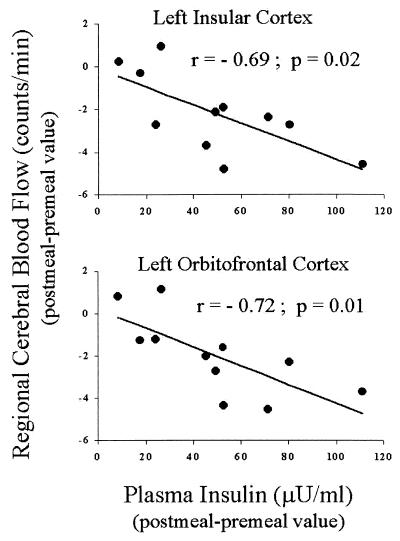
Figure 2.
Correlations between changes in plasma insulin concentrations elicited by satiation and changes in normalized PET counts in the left insular cortex centered around Talairach atlas coordinates (x = −40, y = 12, z = 5; Upper) and left orbitofrontal cortex centered around Talairach atlas coordinates (x = −28, y = 16, z = −12; Lower).

