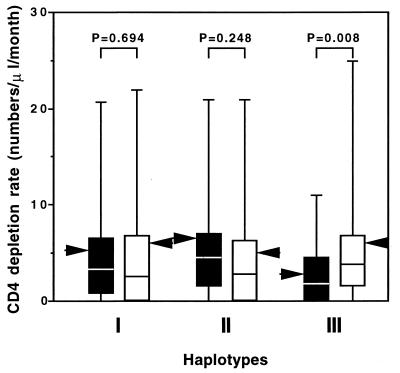
Figure 2.
Effect of sequence polymorphism in RANTES promoter region on CD4+ lymphocyte depletion rate. The bars represent the 25th and 75th percentiles for the CD4+ depletion rate; a horizontal line in the bar represents the 50th (median) percentile and small horizontal lines above and below the bar represent the 5th and the 95th percentiles. Homozygotes and heterozygotes of each haplotype are represented by a black bar. Those lacking each respective haplotype are represented by a white bar. The mean CD4+ depletion rate of each group is shown by an arrowhead. Statistical significance for each difference is indicated.

