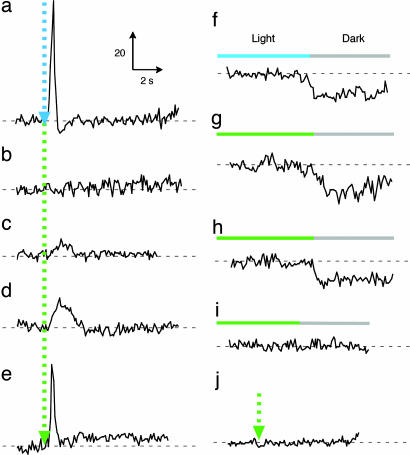
Fig. 4.
Phototaxis responses of BR–HtrII complexes. Swimming reversal frequency responses of cell populations measured by stimulus (at dotted arrow) effects on the ratio of rate of change of direction (RCD) to speed (SPD) by computer-assisted motion analysis. There were 200–2,500 cells assayed for each trace. “BR” designates BR in the following description: 100-ms 500-nm stimulus for SRII/HtrII (a), 500-ms 580-nm stimulus for P200T/V210Y-BR (b), 500-ms 550-nm stimulus for A215T-BR (c), P200T/V210Y/A215T-BR/NpHtrII (d), and P200T/V210Y/A215T-BR/G83F-NpHtrII (j), and 100-ms 550-nm stimulus for P200T/V210Y/A215T-BR/HsHtrII (e). BR mutants containing the A215T mutation have shorter absorbance maxima (λmax, 550 nm) than WT BR (λmax, 580 nm) (27). Swimming reversal frequency transients to a step-down in continuous light as indicated (f–i%). (f) SRII/HtrII; (g) P200T/V210Y/A215T-BR/NpHtrII; (h) P200T/V210Y/A215T-BR/HsHtrII; and (i) P200T/V210Y/A215T-BR/G83F-NpHtrII.

