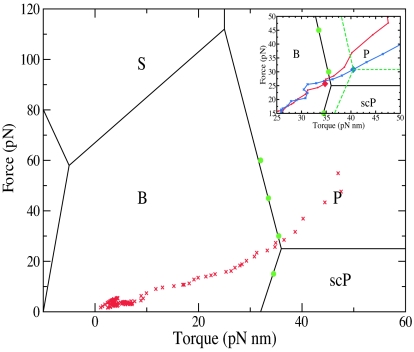
Fig. 4.
The global force-torque phase diagram of DNA overlayed with points in force-torque space from our B to P, reversible, umbrella sampling pathway (or “isotherm”). Points in green have been previously measured experimentally (14). Note that, because the calculated equilibrium pathway yields the lowest force needed to maintain in equilibrium a P-like structure, the isotherm passes almost through the lower right “triple point” between B, P, and scP. This finding indicates that tensions lower than ≈25 pN cannot induce P-forms and validates the experimentally derived phase diagram. (Inset) A zoomed in region of the phase diagram with the value at ρ = 1, an approximate triple point, emphasized with a diamond, and a sketch of what a phase diagram with a triple point at this value may look like with green dashes. For comparison, the DNA isotherm is in red, whereas the RNA isotherm is in blue.

