Fig. 1.
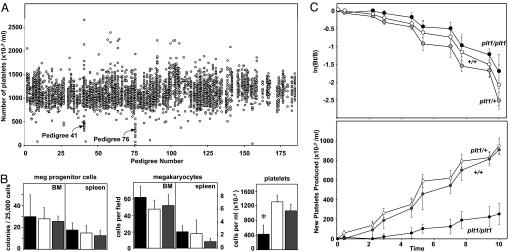
Recessive thrombocytopenia in plt1 mice. (A) Platelet counts from pedigrees of G3 mice segregating ENU-induced mutations. Each data point represents the platelet count from an individual mouse with data from mice of the same pedigree grouped vertically. Two pedigrees in which thrombocytopenia segregated were identified, pedigrees 41 and 76, the latter being subsequently referred to as plt1. (B) Homozygous plt1/plt1 mice exhibit thrombocytopenia without deficiencies in megakaryocyte or megakaryocyte progenitor cell numbers in the bone marrow and spleen. Means ± standard deviations are shown for numbers of megakaryocyte progenitor cells, n = 2–5; megakaryocytes, n = 6; and platelets, n = 15–22 mice per genotype. ∗, P < 0.01 for comparison of data from plt1/plt1 mice with that from plt1/+ and +/+ mice. (C) Reduced rate of platelet production in plt1/plt1 mice. (Upper) The decline in the numbers of biotinylated platelets after pulse labeling in vivo is shown with data expressed as the logarithm of the ratio of the number of labeled platelets at a given time over the initial number of labeled platelets (ln[Bt/B]). (Lower) Rate of appearance of unlabeled platelets after pulse labeling in vivo, a measure of new platelet production. Data from plt1/plt1 mice are shown in black, with that from plt1/+ and +/+ mice shown in white and gray, respectively.

