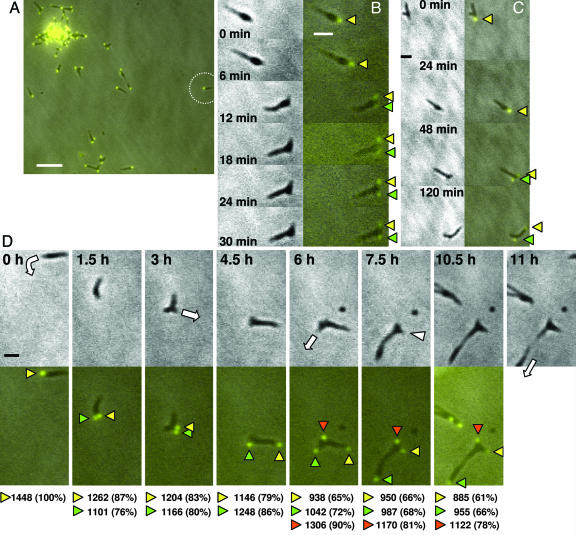
Fig. 1.
Time-lapse phase contrast/fluorescence microscopy of terminal organelle appearance, development, and separation during M. pneumoniae growth. Mutant II-3 plus recombinant P30-YFP has a wild-type phenotype (20); shown are phase contrast and fluorescence images of II-3 plus P30-YFP taken at various intervals over observations of 30 min to 11 h. (A) A representative field for analysis of terminal organelle development. The circle indicates an individual cell monitored in D over 11 h. (Scale bar, 5 μm.) (B) Images were captured over a 30-min period at 6-min intervals. (Left) Phase contrast images. (Right) Merged P30-YFP fluorescence/phase contrast images. Yellow arrowheads indicate the original focus, and green arrowheads indicate the nascent focus. (Scale bar, 1 μm.) For further detail, see Movie 1, which is published as supporting information on the PNAS web site. (C) Selected frames over a 2-h observation. The arrowheads and scale are the same as in B. For further detail, see Movie 2, which is published as supporting information on the PNAS web site. (D) Selected frames over an 11-h observation. (Upper) Phase contrast images. (Lower) Merged P30-YFP fluorescence/phase contrast images. White arrows indicate the direction of cell gliding; white arrowheads indicate cell retraction. Yellow, green, and orange arrowheads indicate the first, second, and third terminal organelles, respectively. The values below the images indicate relative fluorescence units, with the values in parentheses being standardized to the single focus at 0 h. (Scale bar, 1 μm.) For further detail, see Movie 3, which is published as supporting information on the PNAS web site.

